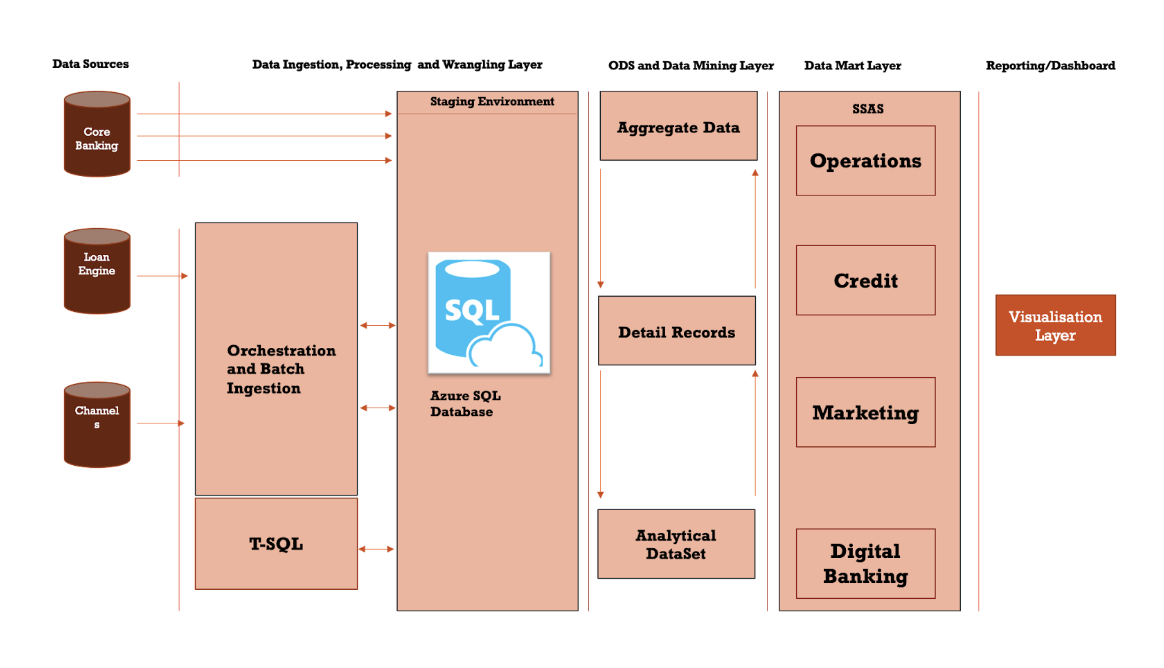
Project Goal
To deliver a cost-effective, scalable Business Intelligence (BI) solution that empowers department heads and analysts to generate actionable insights using structured data from monthly database backups—without relying on expensive enterprise BI licenses.
👤 My Role
As Product Manager and Lead Data Analyst, I led the end-to-end delivery of the BI platform—collaborating with stakeholders across departments, managing a cross-functional team (2 Data Engineers, 1 Backend Developer, 1 QA Engineer), and directly designing data models and dashboards using Apache Superset.
📊 Metrics of Success
- ✅ 100% ETL job success rate within 2 months of go-live
- ✅ Increased report generation efficiency by 60% for Operations and Credit teams
- ✅ Onboarded 30+ users across 5 departments within the first quarter
- ✅ Achieved 99.9% system uptime post-deployment
- ✅ Reduced BI software costs to $0/month using open-source stack
🛠 Tools & Technologies Used
Apache Superset, PostgreSQL, Python (ETL Scripts), Cron Jobs, SQL Server, REST APIs, Linux Server, Google Sheets (for feedback), Slack, Jira
📎 Key Features Delivered
- ETL Automation:
Developed and deployed monthly ETL pipelines that ingested structured data from third-party backups into a reporting database. - Open-Source BI Integration:
Integrated Apache Superset to deliver real-time dashboards and exportable reports tailored to each department’s KPIs. - Access Control:
Implemented role-based access using department-level permissions, with login authentication customised per user group. - Hosted Solution:
The platform was hosted on a secure internal server with URL access, enabling fast and stable system performance for multiple users. - Departmental Dashboards:
Created unique dashboards for Operations, Finance, Loans, and Risk teams, each featuring drill-down capability and historical trend analysis.
👥 Target Audience
- Department heads seeking on-demand performance insights
- Data analysts conducting trend and risk analysis
- IT administrators managing backend server and user access
📏 Functional Requirements Delivered
- Scheduled monthly ETL processes
- Support for trend analysis using up to 24 months of data
- Interactive Superset dashboards with filtering, grouping, and exporting
- Authentication via role-based access (future integration planned for SSO)
- Optimised queries for concurrent dashboard users
📈 Metrics & KPIs Tracked
| KPI | Result |
|---|---|
| Monthly Active Users | 30+ |
| Dashboard Load Time | < 3 seconds |
| Report Exports (per month) | 100+ |
| ETL Completion Rate | 100% within 30 minutes |
| Server Uptime | 99.9% |
| Feedback Score (Avg) | 4.6/5 (Usability & Relevance) |
🔁 Measurement & Iteration Plan
- Collected monthly feedback via embedded Google Form and Slack prompts
- Monitored Superset usage logs to identify underused features
- Refined queries and optimised visuals based on performance logs
- Introduced documentation and in-platform tooltips for non-technical users
- Security audits conducted quarterly to ensure access compliance
🗓 Timeline & Milestones
| Phase | Duration |
|---|---|
| Infrastructure Setup | Week 1–2 |
| ETL Development & Testing | Week 3–4 |
| Dashboard Creation | Week 5–6 |
| QA, Security Assessment | Week 7 |
| Go-Live & User Onboarding | Week 8 |
| Continuous Monitoring & Support | Ongoing |
